- English (UK)
- English (India)
- English (Canada)
- English (Australia)
- English (South Africa)
- English (Philippines)
- English (Nigeria)
- Deutsch
- Español (España)
- Español (México)
- Français
- Italiano
- Nederlands
- Polski
- Português (Portugal)
- Português (Brasil)
- Русский
- Türkçe
- العربية
- Ελληνικά
- Svenska
- Suomi
- עברית
- 日本語
- 한국어
- 简体中文
- 繁體中文
- Bahasa Indonesia
- Bahasa Melayu
- ไทย
- Tiếng Việt
- हिंदी

Phillips 66 (PSX)
Phillips 66 stock price live, this page displays NYSE PSX stock exchange data. View the PSX premarket stock price ahead of the market session or assess the after hours quote. Monitor the latest movements within the Phillips 66 real time stock price chart below.
What Is the Phillips 66 Stock Price Today?
The Phillips 66 stock price today is 161.44.
What Is the Stock Symbol for Phillips 66?
The stock ticker symbol for Phillips 66 is PSX.
Is PSX the Same as $PSX?
$PSX is a common way to refer to the Phillips 66 ticker symbol in social media, forums, and online discussions. The dollar sign is a shorthand convention used to indicate that it is a stock ticker symbol
What Stock Exchange Does Phillips 66 Trade On?
Phillips 66 is listed and trades on the NYSE stock exchange.
Is Phillips 66 a Good Stock to Buy?
Determining whether Phillips 66—or any stock—is a good buy requires comprehensive analysis. To evaluate its potential, users can sign up to InvestingPro, where they can assess the current Phillips 66 share price compared with the fair value and other essential metrics.
You can find more details by visiting the additional pages to view historical data, charts, latest news, analysis or visit the forum to view opinions on the PSX quote. (ISIN: US7185461040)
Fair Value
An estimate of a stock's true price based on valuation models like discounted cash flow, peer valuation multiples, and dividend discount models.
Day's Range
156.91
161.86
52 wk Range
95.70
190.61
Earnings results expected in 13 days
1/2
Fair Value
An estimate of a stock's true price based on valuation models like discounted cash flow, peer valuation multiples, and dividend discount models.
Day's Range
156.91161.86
52 wk Range
95.70190.61
Key Statistics
Edit
Prev. Close
Open
Volume
Average Vol. (3m)
1-Year Change
Book Value / Share
Fair Value
Fair Value Upside
Market Cap
Shares Outstanding
Revenue
Net Income
EPS
EPS Growth Forecast
Next Earnings Date
(3.17%)
Dividends Payment Streak
P/E Ratio
Return on Assets
Return on Equity
Gross Profit Margin
Price/Book
EBITDA
EV/EBITDA
Beta
PSX Scorecard
Company’s Health
Assesses a company's financial position by analyzing its market value, financial ratios, industry benchmarks, and competitors.
UnlockFair Value
An estimate of a stock's true price based on valuation models like discounted cash flow, peer valuation multiples, and dividend discount models.
Unlock PriceTechnical Analysis
Strong Sell
Price Target
180.55
Upside
+11.84%
Members' Sentiments
Bearish
Bullish
ProTips
Tips that distill complex financial data into concise, actionable investment insights.
11 analysts have revised their earnings downwards for the upcoming period
Technical Analysis
Summary
Strong Sell
Sell
Neutral
Buy
Strong Buy
Buy
Technical Indicators
Strong Buy
Moving Averages
Neutral
Phillips 66 operates as an integrated downstream energy provider in the United States, the United Kingdom, Germany, and internationally. It operates through five segments: Midstream, Chemicals, Refining, Marketing and Specialties (M&S), and Renewable Fuels. The Midstream segment provides crude oil and refined petroleum product transportation, terminaling, and storage services, as well as natural gas and natural gas liquids (NGL) gathering, processing, transportation, fractionation, storage and marketing services. It also exports liquefied petroleum gas. The Chemicals segment produces and markets ethylene and other olefin products; aromatics and styrenics products, such as benzene, cyclohexane, styrene, and polystyrene; various specialty chemical products, including organosulfur chemicals, solvents, catalysts, and chemicals used in drilling and mining; and petrochemicals and plastics. The Refining segment refines crude oil and other feedstocks into petroleum products, such as gasolines and distillates, including aviation fuels. The M&S segment purchases for resale and markets refined products, including gasolines, distillates, and aviation fuels. This segment also manufactures and markets specialty products, such as automotive, commercial, industrial, and specialty lubricants, as well as base oils. The Renewable Fuels segment processes renewable feedstocks into renewable products, as well as supplies sustainable aviation fuel. This segment also procures renewable feedstocks, manages certain regulatory credits, and markets renewable diesel, renewable jet fuel, and other renewable fuels. The company markets its products under the Phillips 66, Conoco and 76, JET, Kendall, Red Line, and other private label brands. Phillips 66 was founded in 1875 and is headquartered in Houston, Texas.
Phillips 66 Earnings Call Summary for Q4/2025
- Phillips 66 reported Q4 2025 adjusted EPS of $2.47, beating forecasts by 9.78%, while revenue of $32.14 billion missed expectations by 5.86%
- The company generated $2.8 billion in operating cash flow and returned $756 million to shareholders, with stock rising 3.97% to $148.21 in pre-market trading
- CEO Mark Lashier called 2025 'pivotal,' highlighting strategic infrastructure investments including Coastal Bend pipeline expansion and new gas plants
- Phillips 66 projects a midstream adjusted EBITDA run rate of $4.5 billion by end-2027 and expects mid-single-digit growth in midstream EBITDA
- For Q1 2026, the company forecasts global O&P utilization rates in the mid-90s with turnaround expenses of $170-$190 million ($550-$600 million for full year)
Last Updated: 02/04/2026, 01:16 PM
Read Full TranscriptPhillips 66 investor slides for Q4/2025
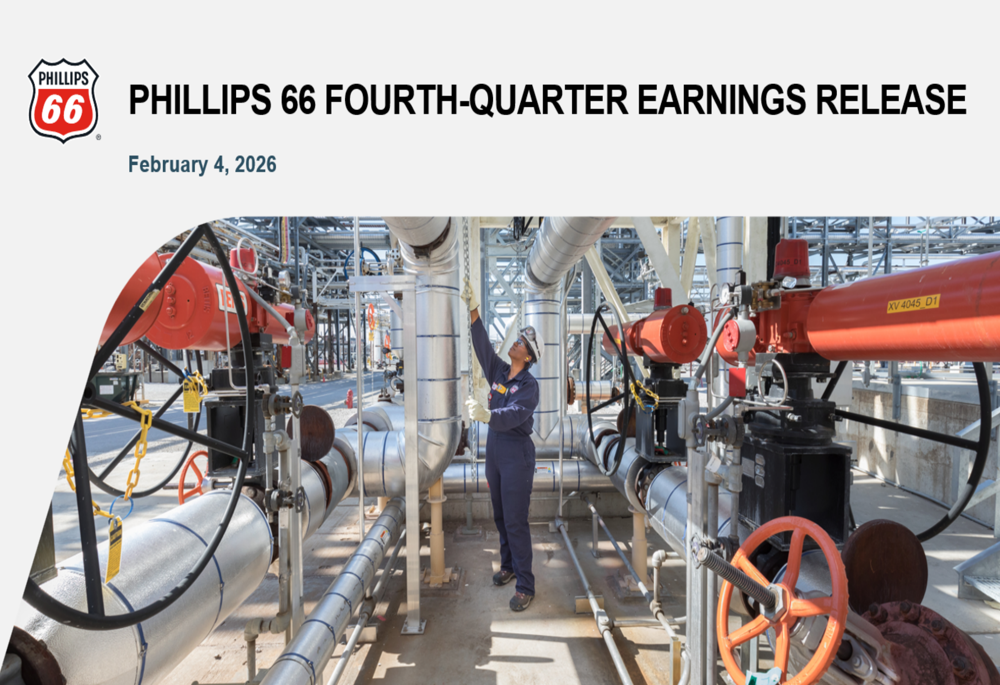
Last Update: Feb 04, 2026
See full investor slides
Compare PSX to Peers and Sector
Metrics to compare | PSX | Sector Sector - Average of metrics from a broad group of related Energy sector companies | Relationship RelationshipPSXPeersSector | |
|---|---|---|---|---|
P/E Ratio | 14.7x | 15.5x | 6.9x | |
PEG Ratio | 0.13 | 0.08 | 0.00 | |
Price / Book | 2.2x | 1.5x | 1.1x | |
Price / LTM Sales | 0.5x | 0.8x | 1.5x | |
Upside (Analyst Target) | 13.4% | 10.7% | 16.3% | |
Fair Value Upside | Unlock | 28.2% | 5.9% | Unlock |
Analyst Ratings
9 Buy
11 Hold
1 Sell
Ratings:
21 analysts
Overall Consensus
Buy
Analysts 12-Month Price Target:
Average 180.55
(+11.84% Upside)
Earnings
Latest Release
Feb 04, 2026
EPS / Forecast
2.47 / 2.25
Revenue / Forecast
32.14B / 34.14B
People Also Watch
FAQ
What Is the Phillips 66 (PSX) Stock Price Today?
The Phillips 66 stock price today is 161.44 USD.
What Stock Exchange Does Phillips 66 Trade On?
Phillips 66 is listed and trades on the New York Stock Exchange.
What Is the Stock Symbol for Phillips 66?
The stock symbol for Phillips 66 is "PSX."
Does Phillips 66 Pay Dividends? What’s The Current Dividend Yield?
The Phillips 66 dividend yield is 3.17%.
What Is the Phillips 66 Market Cap?
As of today, Phillips 66 market cap is 64.79B USD.
What Is Phillips 66's Earnings Per Share (TTM)?
The Phillips 66 EPS (TTM) is 10.79.
When Is the Next Phillips 66 Earnings Date?
Phillips 66 will release its next earnings report on Apr 29, 2026.
From a Technical Analysis Perspective, Is PSX a Buy or Sell?
Based on moving averages and other technical indicators, the daily buy/sell signal is Strong Sell.
How Many Times Has Phillips 66 Stock Split?
Phillips 66 has split 0 times.
How Many Employees Does Phillips 66 Have?
Phillips 66 has 12600 employees.
What is the current trading status of Phillips 66 (PSX)?
As of Apr 16, 2026, Phillips 66 (PSX) is trading at a price of 161.44 USD, with a previous close of 158.76 USD. The stock has fluctuated within a day range of 156.91 USD to 161.86 USD, while its 52-week range spans from 95.70 USD to 190.61 USD.
What Is Phillips 66 (PSX) Price Target According to Analysts?
The average 12-month price target for Phillips 66 is 180.55 USD, with a high estimate of 213 USD and a low estimate of 138 USD. 9 analysts recommend buying the stock, while 1 suggest selling, leading to an overall rating of Buy. The stock has an +11.84% Upside potential.
What Is the PSX Premarket Price?
PSX's last pre-market stock price is 158.91 USD. The pre-market share volume is 2,540.00, and the stock has decreased by 0.15, or 0.09%.
What Is the PSX After Hours Price?
PSX's last after hours stock price is 161.53 USD, the stock has decreased by 0.09, or 0.06%.
Install Our App
Risk Disclosure: Trading in financial instruments and/or cryptocurrencies involves high risks including the risk of losing some, or all, of your investment amount, and may not be suitable for all investors. Prices of cryptocurrencies are extremely volatile and may be affected by external factors such as financial, regulatory or political events. Trading on margin increases the financial risks.
Before deciding to trade in financial instrument or cryptocurrencies you should be fully informed of the risks and costs associated with trading the financial markets, carefully consider your investment objectives, level of experience, and risk appetite, and seek professional advice where needed.
Fusion Media would like to remind you that the data contained in this website is not necessarily real-time nor accurate. The data and prices on the website are not necessarily provided by any market or exchange, but may be provided by market makers, and so prices may not be accurate and may differ from the actual price at any given market, meaning prices are indicative and not appropriate for trading purposes. Fusion Media and any provider of the data contained in this website will not accept liability for any loss or damage as a result of your trading, or your reliance on the information contained within this website.
It is prohibited to use, store, reproduce, display, modify, transmit or distribute the data contained in this website without the explicit prior written permission of Fusion Media and/or the data provider. All intellectual property rights are reserved by the providers and/or the exchange providing the data contained in this website.
Fusion Media may be compensated by the advertisers that appear on the website, based on your interaction with the advertisements or advertisers.
© 2007-2026 - Fusion Media Limited. All Rights Reserved.